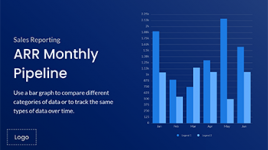
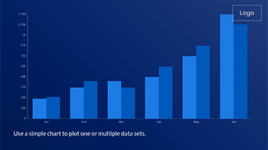
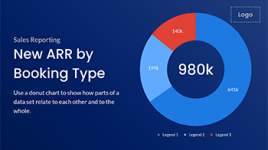
Use a line chart to showcase data that changes over time, displaying variations in stock prices, vehicle sales figures, or even the number of customer service tickets received. The slopes that connect dots on a grid let you know whether the data is growing or decreasing, allowing for projections and identifying trends.
Goals & Performance
This template comes pre-installed in every Appspace account.
© 2026 Appspace Inc. Appspace is a registered trademark of Appspace Inc. All rights reserved.