Features and Description
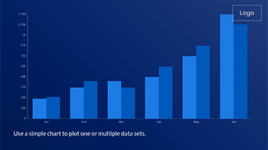
Bring data to life using an animated bar chart for data visualization. Share metrics and results with different teams or the entire organization. Compare different categories of data or track the same types of data over time.
- Display animated vertical or horizontal bars.
- Include up to 8 items in the data series
- Display a legend, gridlines, and labels
- Select the color of the value, and bar
- Supports percentage (%) data
- Change colors, text, icon, and images to match your brand standards
- Fully responsive, works on mobile devices, tablets, desktops, and digital signage
- Works with all devices running the Appspace App